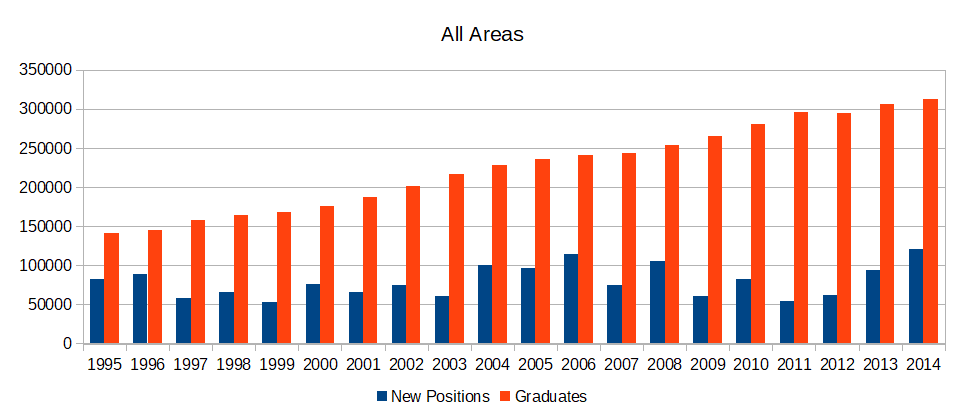
To further my earlier post on STEM oversupply, I took a look at historical graduate numbers and job openings (on a three year rolling average to smooth out fluctuations), using data from the ABS and the Department of Education & Training, accounting for not just retirement but also deaths and migration (though occupation data on skilled migrants isn’t available). In short – even under the old restricted entry system, graduates often outpaced opportunities but the combination of economic slowdown and increased access to education after the GFC has led to this gap widening to its present unsustainable level.

I’ll mostly let the graphs speak for themselves, but the clear takeaway from the generalised case is the continual growth of graduates, unimpeded by economic circumstances.

We have no physical science or mathematics industries in this country. Hence, no jobs. Graduates have always had dreadful prospects, though the double counting of students who get a Bachelor’s and then a PhD makes reality slightly easier than it might appear.

This sector is dominated by farmers and farm managers who have been in terminal decline (and apparently require a Bachelor’s degree, at least according to the Department of Employment guidelines), dropping from 250,000 workers in 2001 to 144,000 in 2016. Due to the size of that sector in comparison to how many graduates study it, even the pause in its decline through the mid 2000s appears to be a period of growth, but is only due to old farmers retiring or dying.

The delayed effect of the old capped place system can be seen clearly in the IT sector. Demand for graduates booms during the tech bubble, which leads to a delayed increase in graduates in the early-2000s, by which time the sector has trained those physical science students and doesn’t need the resultant influx. In modern times IT supply and demand appear to track quite well, and it’s surprising that more students aren’t being shuffled into the field given the paucity of opportunities elsewhere. This limitations in my data meant that I applied the impact of immigration proportionally across all areas, but anecdotally much of the demand for employer sponsered visas are driven by IT companies, which exposes a weakness in my method. If only the Department of Immigration spent more time on compiling data for researchers, instead of crimes against humanity.

The engineering sector tracks the mining and property booms, with strong conditions through much of the 2000s. But the data also shows how cyclical employment can be, with engineering jobs hit hard by slumps.

The construction sector is another with hefty boom and bust cycles, showing strong growth through the mid-2000s, but also negative growth at times when the economy isn’t tracking so well. A big chunk of this sector are construction managers, who the Department places as requiring a Bachelor’s, but from my experience are often filled by experienced tradespeople, so the opportunities apparent in this sector for graduates may be overstated.

Management and commerce is our largest tertiary educated sector, covering many who keep business operating, from accountants to managers and HR professionals. For folks whose business is in private industry, they sure seem to have ignored the slowing conditions after places were deregulated. Demand for these degrees kept climbing, even with job supply dropping off as economic conditions weakened. Maybe they should have talked to an economist from the society and culture sector, instead of the advertising and marketing professionals here.

The social sciences area has seen near doublings of both the number of lawyers and social services professionals since 2002. Despite this, the immense popularity of degrees in this area (I presume in law rather than in social work or anthropology) has led to supply far outstripping demand.

The arts aren’t actually a bad choice, despite their reputation. The supply of graduates has outstripped demand by a fair amount, but in 2015 we had equally many journalists and other writers as were employed in the entirety of the physical and natural sciences.

The education industry is pretty steady, with reasonably reliable demand for teachers. I guess sectors which are state controlled have less fluctuations due to the vagarities of the markets.

Much like education, health shows steady growth of positions: not enough to take all the graduates, but the gap is much smaller than in most areas. The recent buildup of both supply and demand reflects our aging population, as well as students choosing to study an area in which jobs exist.
So there’s a data-derived look at the recent prospects for graduates across subject areas, something which I would have much appreciated when I chose my degree rather than the platitudes which I got. The health, education and IT sectors are probably the best bets, but if you’re elsewhere then remember, Aldi, Woolworths and Coles all made the top 30 destinations for graduates in 2016! I’ve got some more ideas on how to slice and dice the data, so you can expect another post or two around this area in the future.